what’s in my blood?
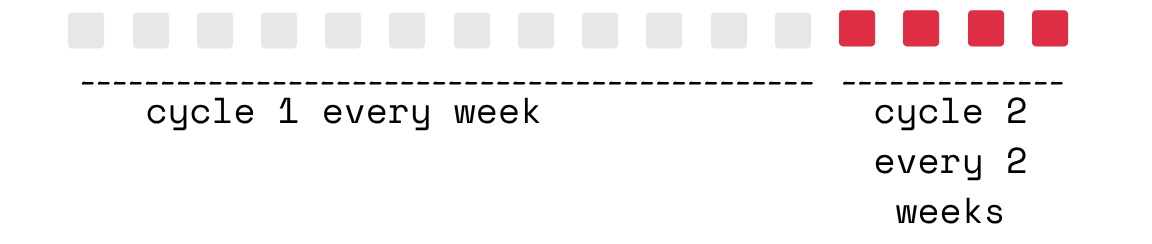
The treatment for my breast cancer entailed a difficult and long chemotherapy period, with a cycle of weekly sessions for 12 weeks, and a cycle of biweekly sessions for 8 weeks.
Here is a small schema for it:
Not a lot of people know this - and I didn’t know before I got sick - but you can’t have chemotherapy if your blood is not good enough. But what does that mean? when it’s your blood good enough to tolerate chemotherapy?
At the hospital, on every chemotherapy day, an entire blood run was performed for me and, amongst other things, two metrics were closely monitored:
- amount of hemoglobin: this has been the weakest point in my body throughout chemotherapy; somehow I stopped producing enough healthy red blood cells, which meant I was often tired, to the verge of continuous fatigue during the hardest weeks of my treatment;
- absolute neutrophil count: this is a key metric for every oncological patient; neutrophils are a type of white blood cells crucial for fighting infections, and chemotherapy brings this count lower - less than 1500 means that neutropenia is occurring, and receiving chemotherapy is often considered too risky.
my blood data
In Flanders, Belgium - where I live - patients can use a digital collaboration platform called CoZo (from Collaboratief Zorgplatform) to access their health data. The platform is actually used also by healthcare providers and institutions to quickly and securely exchange and share medical data across different parties.
During my chemotherapy, I was interested in understanding how good (or better: how bad) my blood was behaving, so every time I went through a blood run - and when I had the energy, which, admittedly, did not happen a lot - I downloaded the PDF reports of the lab work and I extracted the values of hemoglobin and absolute neutrophil count.
I did this for the course of several weeks, added the data to Flourish (a data visualization platform), and made this chart:
The chart shows on the x-axis the date of my blood run, and on the y-axis the values of the hemoglobin (line above) and the absolute neutrophil count (line below).
I’ll walk you through some key data points.
The 8th of November 2023 I started chemotherapy: this is where the measurements begin, right before my first chemotherapy session. Back then, my hemoglobin was 12 and a half and my absolute neutrophil count more than 7000. One session of chemotherapy was enough to bring my hemoglobin down to 10.9 and my absolute neutrophil count to a little more than 3000. Damn, that’s insane.
Every time the line at the bottom, the neutrophil one, went below 1500, neutropenia was happening and I had to skip chemotherapy.
Every time the line at the top, the hemoglobin one, was around 8 or below, I had to get a blood transfusion.
Between February and March 2024 I got an infection via my port-a-cath: you can see my neutrophil count spiking back to 6000, a clear sign that my poor body was definitely doing its best to protect me. And spectacularly failing.
The data are here if you want to have a look or perhaps recreate my chart - not sure why you’d want to do that, but you absolutely can. I am looking for a way to transform this plot into something more artsy, a landscape, a road, a collage, I am not sure.
you have an idea? let me know :)